Disimula – Monitoring and observability
Structured logs with request ids end to end, business and technical metrics, provisioned Grafana dashboards, alerts to Telegram and an external heartbeat for when the server itself is down.
Logs: one request, one id, everywhere
- The backend logs one line per API call (
RequestLog: method, path, status, duration, caller) and one line per thing that happens in a service (a game created, started, finished; a payment; a generation approved...). - In production every line is a JSON object (Spring Boot's structured logging, logstash format), which Loki reads field by field. Locally it stays plain text.
- Every line carries the request id: Cloudflare's
Cf-Rayheader when behind Cloudflare, a random one otherwise. It is sent back to the browser asX-Request-Id. From an error a user reports to its log lines, and to Cloudflare's own logs, with one string. - 5xx answers are logged as WARN; unexpected errors with their stack trace and a generic
500 internal_errorto the client. Health checks are not logged; the AI worker's polling only when it fails. - Missions are never logged. Lines carry ids, emails and counts.
- The online Worker logs on Cloudflare (Workers Logs): every request, plus
room_opened,room_deleted,room_expiredandroom_error.
{service="backend"} | request_id="<the request id>"           everything one request did
{service="backend"} |= "RequestLog" | json | status >= 400     failed API calls
{level="ERROR"}                                               every error on the server
Metrics
| Source | What |
|---|---|
| Host | CPU, memory, disks |
Backend (/actuator/prometheus) | requests and latencies, JVM, Hikari connection pool |
| Backend events | disimula_<what>_total: games created, started, finished, deleted; accounts; generations queued and how they ended; checkouts, payments, refunds, webhooks by outcome, payments needing a hand, codes redeemed |
| Outbound calls | disimula_client_requests_seconds{client, outcome} for Paddle and the online rooms |
| PostgreSQL | size, connections, transactions, plus usage and sales queries (counts and sums only) |
| Probes | every 30 s: the frontend, the tunnel's readiness, Loki |
Event counters restart at 0 when the backend restarts, which increase() handles; for money and
totals, the database queries are the record. Domain code emits events through an Activity port in
the shared kernel, implemented with Micrometer, so the domain stays framework-free.
The stack
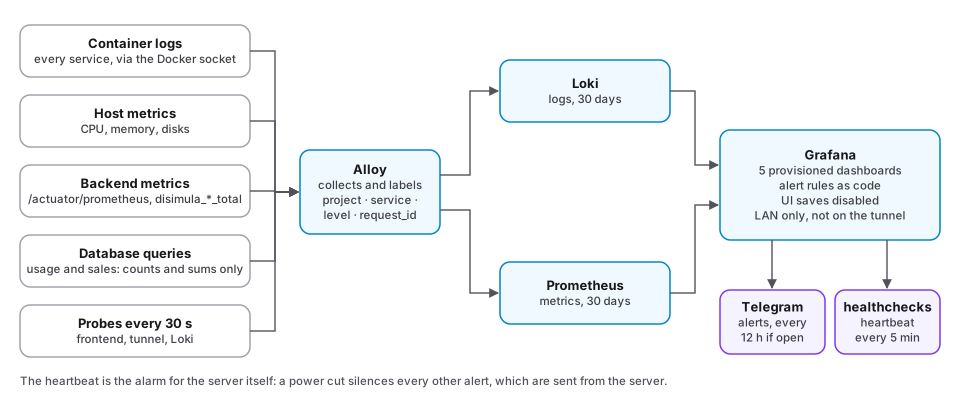
Grafana, Prometheus, Loki and Grafana Alloy as a separate compose project on the server:
- Alloy reads the containers' logs through the Docker socket, labels them by
project,service,containerandlevel, attaches the backend'srequest_idas structured metadata, and scrapes metrics. - Everything is kept 30 days; every service is memory-capped, around 600 MB in total.
- Grafana is not on the internet: no tunnel hostname, LAN only, optionally bound to localhost and reached through SSH.
Everything is provisioned
Nothing in Grafana is configured by hand:
| What | Where |
|---|---|
| What is collected | config.alloy, postgres-queries.yaml |
| Data sources | grafana/provisioning/datasources/ |
| Dashboards | grafana/dashboards/*.json |
| Alert rules | grafana/provisioning/alerting/rules.yaml |
| Contact points, message templates | contact-points.yaml, templates.yaml |
| Secrets (bot token, heartbeat URL) | the server's env file, never the repository |
Saving from Grafana's UI is disabled, so no change can live only there: you edit, Grafana refuses to
save and shows the JSON, which goes back into the repository. Before every production deploy,
check.sh loads all of it in a throwaway Grafana and stops the deploy if anything is broken.
Dashboards
- Home server (opens first): the machine, every service up or down, the backend, warnings and errors of every container.
- Disimula: how the app is used: games, players, people, AI generations, recent events.
- Disimula billing: what sells, refunds, Paddle's webhooks and API latency.
- Disimula logs: every line, searchable by request id, text and level.
- Disimula database: size, connections, transactions and backups.
Linked to each other in a bar at the top (by tag).
Alerts
To a Telegram chat, one short message each: what is wrong and what command to run. A problem that stays is repeated every 12 hours, and its resolution is announced.
| Alert | When |
|---|---|
| Backend down / a service not answering / database down | no answer for a few minutes |
| Answering with errors | any recent 5xx |
| Logged an error | an ERROR line from any of its services |
| Slow | p95 latency too high for a while |
| Waiting for database connections | requests queueing for the pool |
| Running out of memory | heap close to full for a while |
| Nobody is writing the queued AI generations | queued, none running, for a while |
| An AI generation failed | as it happens |
| Cannot reach Paddle or the online rooms | an outbound call with no answer or a 5xx |
| Paddle's webhooks are being rejected | invalid signatures arriving |
| No recent database backup | none in the last day |
| Disk, memory, CPU | running low or saturated |
| The monitoring itself | Alloy, Prometheus or Loki stopped for 5 min |
Who watches the watcher
All those alerts are sent from the server, so a power cut or a dead connection would silence them. Grafana therefore pings an external heartbeat (healthchecks.io, free) every 5 minutes; if the pings stop for 10 minutes, healthchecks.io alerts the same Telegram chat. The heartbeat proves Grafana runs and reaches the internet; the other alerts cover the rest.
In the app
Besides Grafana, admins have the in-app panels (usage, AI usage, user explorer, billing), built on SQL
read models in the stats feature, for questions about the product rather than the machine.